Hive
Product Design Intern
PM + Engineering
1 month

Snapshot
Hive’s portal surfaced models, usage analytics, and exploration tools through a fragmented and visually noisy interface. Users struggled to understand model value, interpret usage data, and navigate between exploration and action. I led an information architecture redesign that streamlined the portal into a goal-oriented system, improving model discoverability, usage comprehension, and decision efficiency.
Core Problem
Models were presented without clear value framing
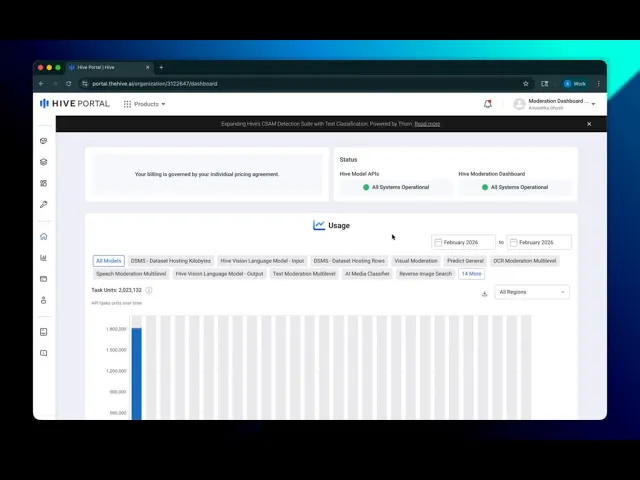
Usage charts lacked context, filters, and interpretability
Explore page filtering broke established mental models
Portal architecture prioritized feature density over flow
The portal behaved like a collection of cards, not a cohesive product system.
Approach
Strategy
Audited portal flows to identify hierarchy breakdowns
Reframed portal from “model inventory” to “decision-support system”
Prioritized key user goals: explore → evaluate → adopt → monitor
Aligned redesign with business objective of increasing model engagement
Interaction & Systems
Redesigned model cards to emphasize value proposition and visual clarity
Introduced structured month-on-month usage analytics with tooltips and filters
Rebuilt usage charts to support comparison across models
Relocated filtering to left panel using conventional SaaS patterns
Reduced scrolling and decision friction through category-based filtering
Established consistent panel hierarchy with clear, salient CTAs
Execution
Leveraged and extended existing design system components
Designed scalable layout patterns for future model additions
Partnered closely with engineering to ensure chart feasibility
Delivered interaction specs and responsive states
Visual Evidence

Impact
28% increase in model exploration clicks within 4 weeks of release
22% reduction in time-to-first-model-selection
35% increase in usage chart interactions after adding filters and tooltips
18% improvement in model adoption from explore page
Reduced support tickets related to usage interpretation by ~20%